|
See the Spread, Stop the Spread
- tracking and stopping the spread of a contagious disease
by Valdis Krebs, Chief Network Scientist @ Orgnet, LLC
|
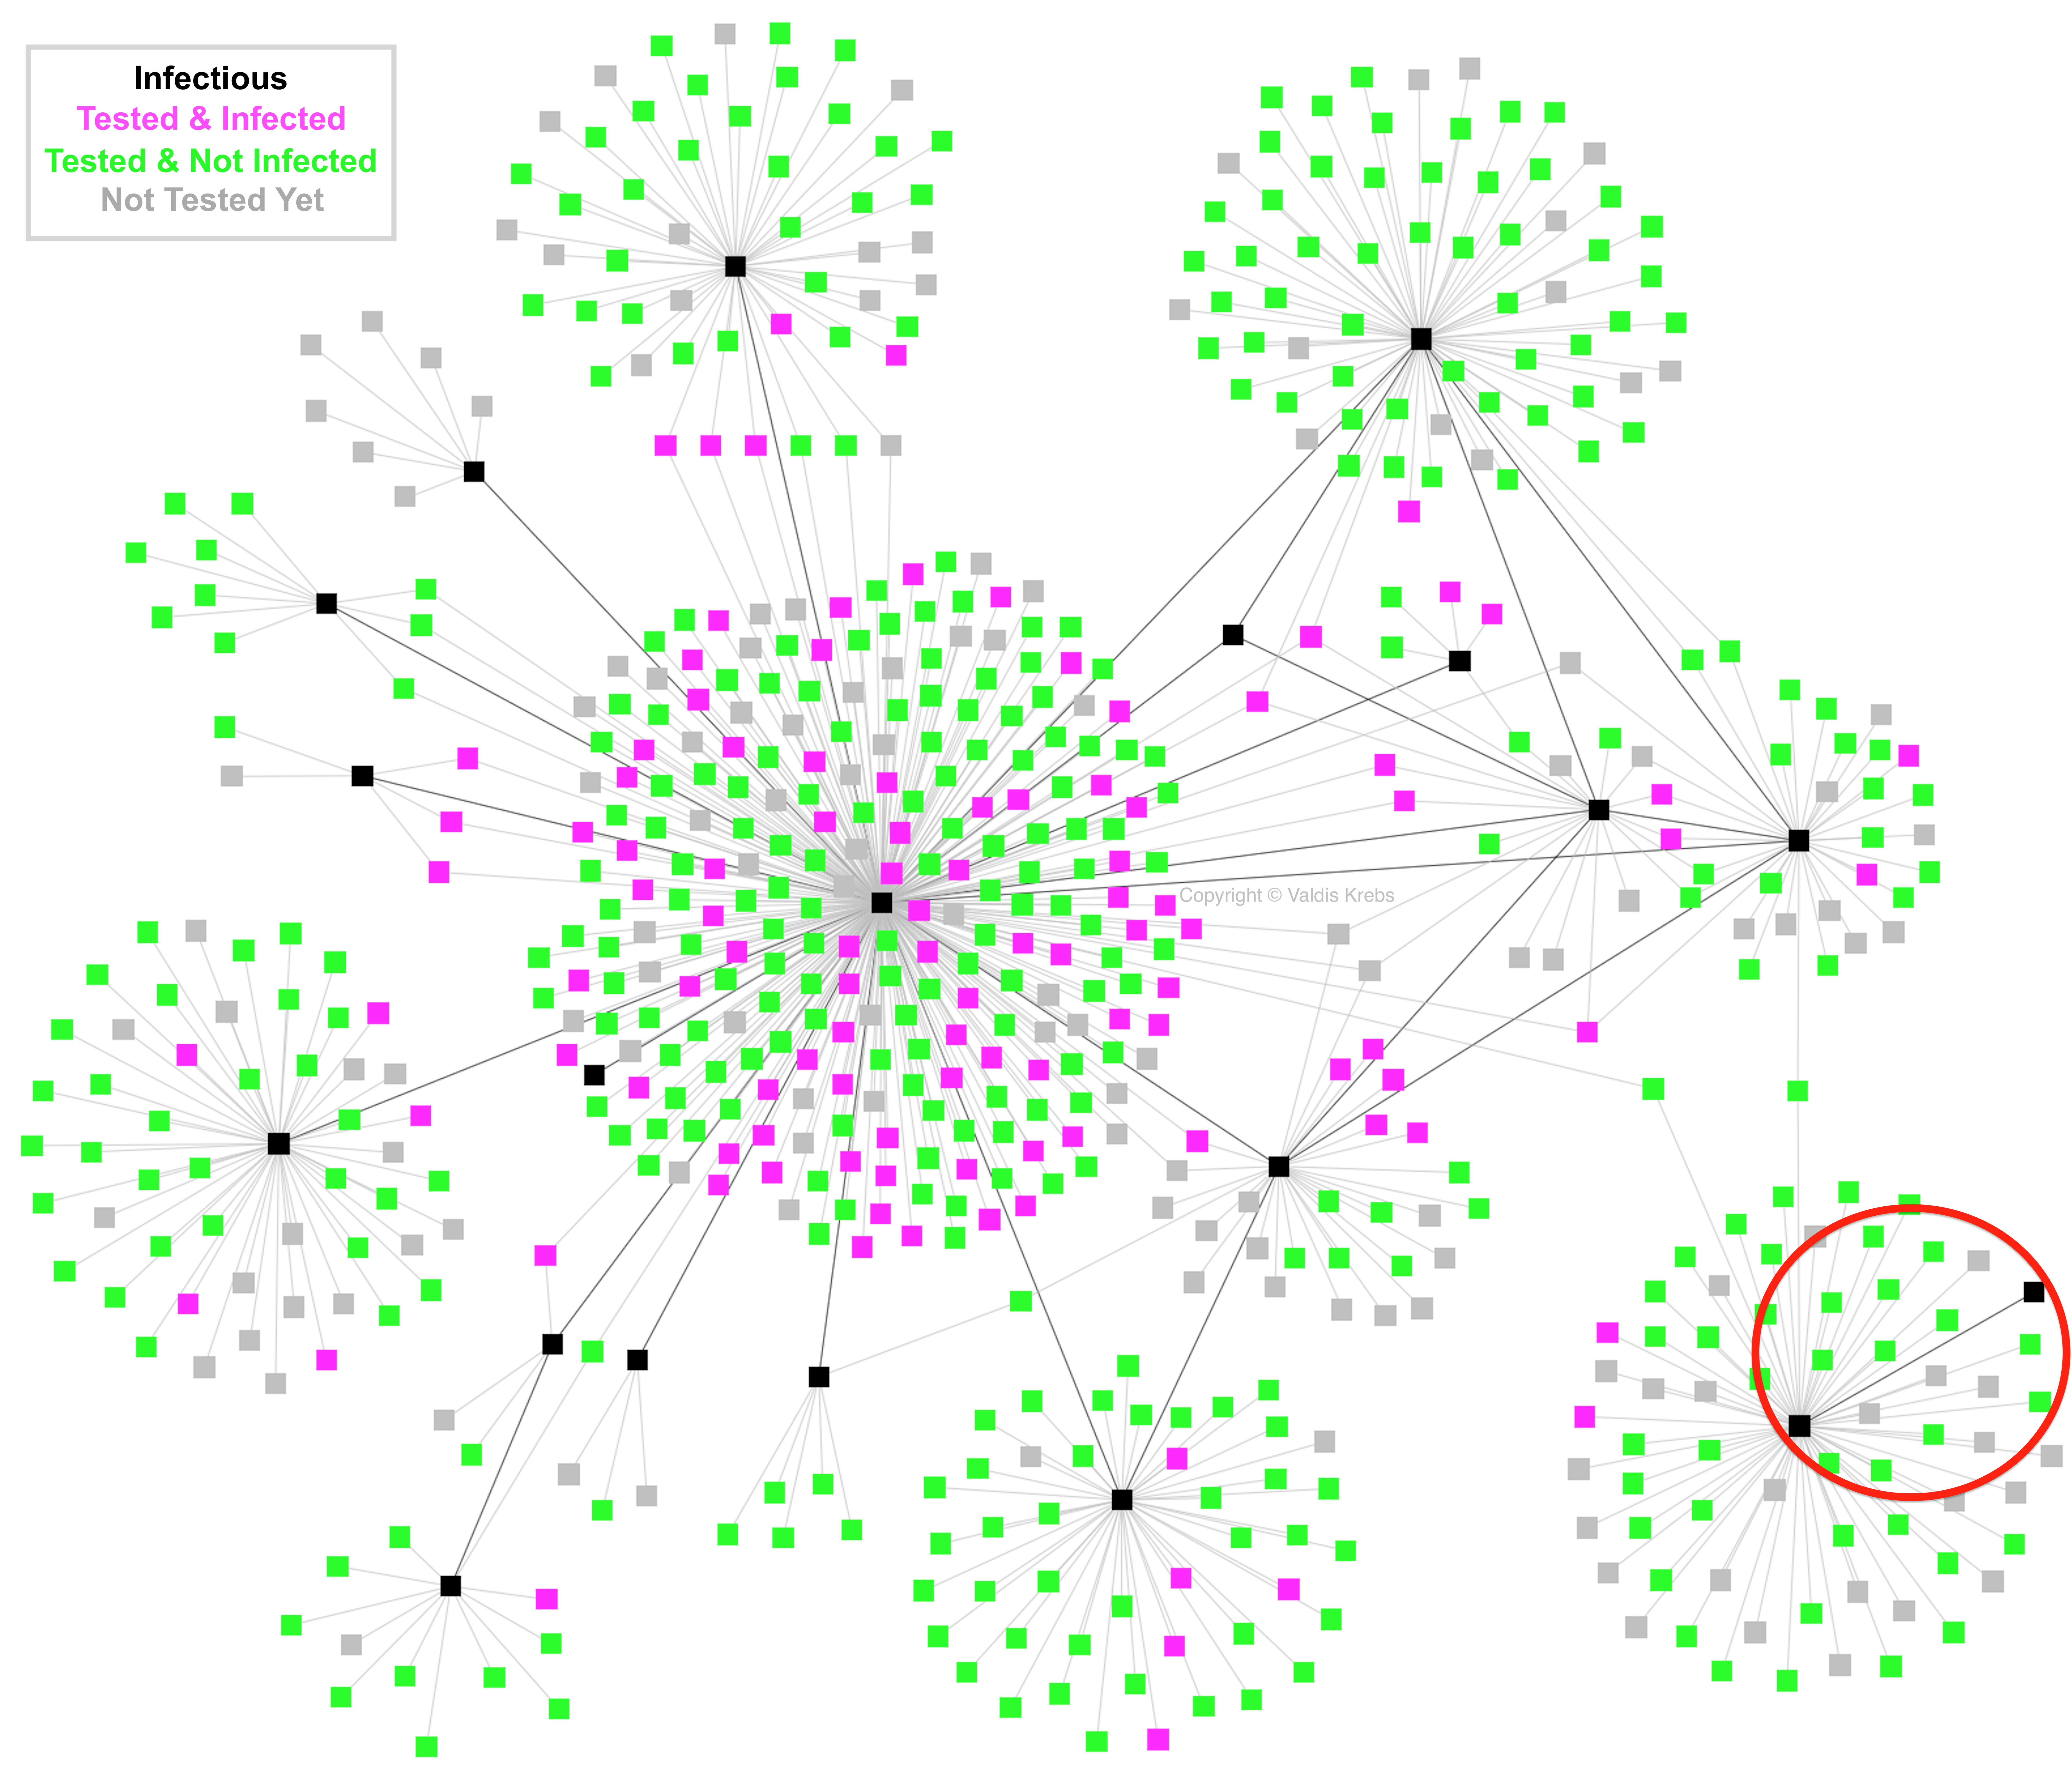
Both good and bad contagions spread via human networks. For good contagions, like ideas, knowledge, and experience we want our networks to quickly spread the information. For bad contagions, like disease or disinformation, we want to quickly spot the source(s) and disrupt the spread. We currently have an outbreak of Covid-19, a.k.a. SARS-Cov-2 or Coronavirus. It is spreading around the world through human contact. Like many infectious diseases, Covid-19 spreads through airborne spray from coughs and sneezes of infected persons. It can also spread from the infectious touching of various surfaces after they have sneezed or coughed into their hand. But airborne transmission is primary! Below, in Figure 1, is a map of an actual disease outbreak. It is not Covid-19, but a disease that also spreads like Covid-19 - via airborne particles or surfaces in the vicinity of infectious persons. This analysis is based on a peer-reviewed article I co-wrote with colleagues at the Centers for Disease Control (CDC). The map below is a TB (tuberculosis) outbreak that happened in southwest America over 10 years ago.
In Figure 1, each node/square represents a person, and each link/line represents a contact between two people. A black node represents infectious persons, a magenta/pink node represents infected people, and those exposed but not infected are shown by a green node. Both the pink and green nodes\\' status was determined after testing them for the disease. Gray nodes were recorded as contacts of the black infectious nodes, but have not been tested as of time of this contact tracing snapshot. The darker lines (links) represent ties/links between the infectious people, and the light gray lines (links) show the ties/links between the infectious and their contacts. Contact TracingEpidemiologists do contact tracing in order to track and stop a disease outbreak. First, they find the sick and treat them while isolating them to prevent further transmission. Next, they find who the sick have recently had contact with. All contacts need testing and monitoring! The battle line against the spread of a contagious disease is drawn around each infectious person and their contacts. If the contacts are tested in time, and the ones showing symptoms are isolated, the continued spread around this person should stop there. Contact tracing is fighting the epidemic at its source! Knowing the contacts of the infected, points public health departments to who requires testing and then who requires monitoring and/or treatment. Each newly discovered infectious case requires a new round of contact tracing around them - who have they had contact with while they were infectious (before and after they were showing obvious symptoms). A contact network is not necessarily a social network. Network contacts might be family, friends, acquaintances, or strangers. We can pick up a disease from a sick family member at home or from a stranger via an inopportune sneeze in a crowded coffee shop. Human networks evolve into what social scientists call "small world networks" - we tend to cluster together via the social dynamic of homophily (i.e. birds of a feather flock together). A small-world network is made up of connected clusters where there are more connections within the cluster than between the clusters. This creates many redundant ties in our closest networks which are very effective at spreading whatever is flowing in those networks. Families that live together have a link between everyone in the dwelling. Most close friends of a person are also friends with each other, and colleagues at work usually work with each other. We end up in clustered communities - good for spreading ideas, knowledge and affection, but also good for spreading disease. We tend to spend more time with family, friends and colleagues, so this gives more time and opportunity for any virus to spread. The Centers for Disease Control (CDC) distinguishes between close contacts and casual contacts when tracing an infectious person\\'s contacts.
But contact networks are not just made up of people we know; they also include general acquaintances (our family doctor, the mail person, the barista at the coffee shop) and total strangers (a traveler at the airport, or a person sitting next to us on the bus). We have both known and unknown contacts. The connections with our known contacts spread the disease within our clusters/communities. But, the connections with unknown contacts can be worse for continuing the outbreak - they can spread the disease between clusters that were previously separated. A bad choice of seats on the bus/plane can result in the spread of a disease from the Smith family to the Jones family - who previously had no interaction. The Jones family may never know where their illness came from. Below, in Figure 2, we see a common 2 x 2 matrix of how our contact networks might be composed. We look at two key factors, Familiarity (how well do we know the person) and Proximity (how close is the physical contact with the person). There are four combinations of Familiarity and Proximity that describe how each of us come in contact with the rest of the world.
In Figure 3, we have eliminated two boxes in the matrix that we really do not need to worry about with the spread of a disease around us. Those far away can not infect us, even if we choose to contact them via some electronic media. The key is face-to-face (F2F) interaction. Both friends and strangers can pass the virus if they are sick and close by. Physical distance stops/slows the spread.
Network Analysis & VisualizationNetwork visualization is an important step forward of utilizing the contact data collected in outbreak investigations. A network visualization can quickly summarize, on one page, the data from many pages of contact tracing data. Attributes of various persons in the outbreak could be quickly designated by node color, shape, size and location. Link direction, thickness and color revealed various attributes of the relationship/flow between the infectious and their contacts. For this demonstration, we keep things simple by just showing the color of both nodes and links. Looking at the network map in Figure 4 our eye naturally gravitates toward the most connected black node in the left-center of the diagram - see the red circle in Figure 4. We look at this person and see he had the most contacts and that he infected the most others (magenta/pink nodes). We might naturally jump to the conclusion: this is a "super-spreader". We assume super-spreaders have some magical power to infect many people. It is not their individual power to infect, it is their location in the network that makes them prolific in spreading a disease.
What was so unique about this person? It was not his personal power to infect - it was his location and longevity. He came into contact with many persons while he was sick, as was not discovered until the outbreak investigation began. He was not only in this city for a long time, he was hard to find. It was determined that he resided in several places during his infectious period, including the county jail where he infected unknown contacts and spread the disease to other social circles. It was determined that he was the index patient of this particular outbreak. Once the outbreak investigation began, we can see that none of the other infectious persons had anywhere as large of a contact circle as the index patient. The other infectious people were processed via contact tracing in a timely manner and therefore had fewer contacts during their infectious period - fewer contacts and fewer infections transferred. This begins to show the power of tracing, mapping, and testing. Knowing who is sick, who are their contacts, and who needs to be tested and monitored, is the sine qua non of epidemiologists stopping outbreaks. This is how you flatten the curve - one exposed sub-network at a time! Since testing is so important to managing and stopping an outbreak, we need to make sure everyone vulnerable gets tested. Pubic health workers need to prioritize who will get tested first, and who can wait. How do they do this? Much of it is based on probability - who is likely to get infected? Here we revert to the two contact categories - close and casual. Previous outbreaks have shown that close contacts tend to spread contagions better than casual contacts. More time together, with more possibility of touch and spray from coughing/sneezing individuals, lead to higher probabilities of infection. Also individuals exposed to more than one infectious person will have a high probability of becoming infected. In Figure 5 we see several individuals (gray nodes) who have been named as contacts, but have not been tested yet, and have had contact with two or more infectious individuals (black nodes). These individuals (grey nodes) should be prioritized for testing - they are shown within the red ovals. We see quite a few individuals with connections to two or more infectious individuals (black nodes) have already been uncovered as infected (magenta/pink nodes). These priority untested individuals can also be discovered using social network analysis metrics that analyze a node\\'s connectivity and reach in a network.
Not only do we want to look at the grey (untested) nodes with many ties, we can get insights into the community spread of the virus by looking at all cases and contacts that have many ties. The cases with many ties are likely to be key spreaders of the disease. In the network map above, cases are also contacts, and only cases can spread the disease. Therefore, those contacts who show up often on multiple contact tracing lists should be immediately investigated to see if they are infectious(cases). We see in our network diagram that the major spreader is also the case/contact with the most ties. He is on more contact lists than any other person. To stop local community spread, focus on those that keep showing up again and again on many contact lists! What else does our network diagram of the outbreak reveal to us? Figure 6 below shows how many social circles were involved in this outbreak. The red oval shows the family/friends of the index patient - these were his known contacts. The other infected individuals (black nodes) are not connected to each other and therefor probably do not know each other and may be members of different social circles - these were the unknown contacts of the index patient, people he probably interacted with in public places that he frequented. It is these infected unknown contacts that take an infection to parts of the network where it is not already active. They are the bridges between the small-worlds (clusters) in human networks.
As we examine the map in Figure 7 (red oval), an interesting anomaly appears. There are two black nodes connected to each other, but not to any of the other infectious black nodes. How did these two get the disease? They do share two contacts (green nodes) with other infectious nodes but there is no line of infection to these nodes from the rest of the infectious group of black nodes. Are we missing an infectious node - a transfer point from the rest to these two? Maybe the transfer point(s) moved out of the area? Or maybe they have died from the disease? Maybe the contact-tracing interview missed some data? There can be several reasons why the spread of the contagion is not always directly linked. These gaps in the spread of the disease need to be investigated to find possible bridges (spreaders) between communities.
Figure 7 Epidemiologists track a reproduction number (R0) of the outbreak. It is a simple measure of how a contagion spreads. It measures, on average, how many other people does an infectious individual infect. But averages can be misleading. They reduce the variability and clumpiness of the data set to one number, which hides a lot of the interesting variability and patterns in the data set. Looking at the network maps above we see two things immediately.
The index patient definitely jumps out as being different and he skews the average greatly. But some infectious people infect 0 or 1 other persons - a very low reproduction rate for the spread. An R0 of one (1) or below means that an outbreak will not happen, an R0 in the double digits means the spread will be rapid locally. Most common diseases have an R0 of less than 5 - meaning the disease will spread if not controlled, but that it is manageable with a proper response - treatment, contact tracing, testing, and monitoring. It is fortunate that not everyone in this outbreak had the infection rate of the index patient. His infection rate shows what can happen if public health officials are not aware of a current disease outbreak, even if it is from just one person. Outbreaks are normally not recognized before several people in one location come down with the same disease at the same time. Transmission Network Analysis (TNA) is best applied early in an outbreak before a mass outbreak sets in to a local area. Tracking the early cases provides great insight into how, when, and where the contagion is spreading. Data collection is difficult but always proves worthy to the understanding and management of the outbreak. Digital Contact TracingMight automated data collection aid the contact tracing process? Can we collect mobile phone location data of persons and those in close proximity with them? This approach has all sorts of privacy implications! But, knowing that two phones were within 3 meters for 10 minutes on X date, at Y time might help to quickly map the recent contact network of newly discovered infectious cases. The phone numbers could be used as both a contact ID for the database as well as a means of contacting the exposed person to notify them of possible exposure. Bluetooth communication between phones may be another option that can enable easier privacy safeguards. A problem with an automated approach might be with finding too many false positives. After all, we have seen from the data above, and other outbreak data, that "contact" does not always result in infection. Where do we set the bar for what is sufficient contact for a high probability of transmitting a disease? A system that sends out too many false warnings of possible "transmission contacts" will soon be ignored or disabled. This is not a simple problem, and one that varies with context of apparent human interaction. What about accidental contacts -- you forget your phone in your car and then everyone that walks/drives by your vehicle is now registered as a possible contact? Human behavior is very complex, full of intentions, appearances, and errors. Can algorithms keep up with making sense of what is going on, and where the real transmission probabilities really are? Another thing about contact tracing is that you do not need to collect every last contact a person has had in a recent time period. Close contacts are more likely to infect (can the distance between two smartphones be estimated, based on signal stregthy excahnged?). Those are much easier to collect during times of isolation and physical distancing -- we know exactly which handful of people we have been spending our time with and where that happened. People working in public places (grocery stores, pharmacies, etc), after government isolation orders, have a more difficult time, but they may not spend sufficient time with any one customer to have a high probability of transmission -- though an unintended sneeze/cough is always possible. There are now various global efforts to look at the feasibility of automated, yet private, data collection for contact tracing. How many people will voluntarily use such apps? Maybe 10-15%? That is probably not enough to accomplish what the app is designed to do. Some recent network studies suggest that a tipping point often occurs in human networks with an adoption of a new behavior by 1/4 to 1/3 of the population. Will 25%+ of a population adopt contact tracing apps??? There is still a portion of all populations that do not have, or that share, a mobile phone. Although the elederly have adopted smartphones at a lower rate than younger age groups, and are more prone to adverse results from a disease, they may be partially protected if the people they come in contact with have adopted a contact tracing app and isolate once warned of a possible adverse contact. Every person who is removed from the disease transmission chain helps the remaining population by reducing the chance of exposure and infection. While new methods are explored, established approaches to contact tracing, aided by network analysis should be vigorously pursued in all local early outbreaks! We need to both elongate and fragment known chains of transmission, to slow their growth, and then stop the outbreak. To summarize, we should follow this mantra: | TEST, TREAT, TRACE, TRACK | REPEAT Testing shows us who is sick -- the new cases, and who is not. Treating, includes healing, and isolating the sick. (Contact) Tracing finds the contacts that have been exposed by the new cases, and isolating them when necessary. Tracking includes, testing and re-testing of cases and contacts until they are in the clear. Stopping the spread takes a multi-pronged ongoing approach. The outcome of this pandemic will be totally dependent on how we respond to it - case by case, local network by local network. Bibliography:
|
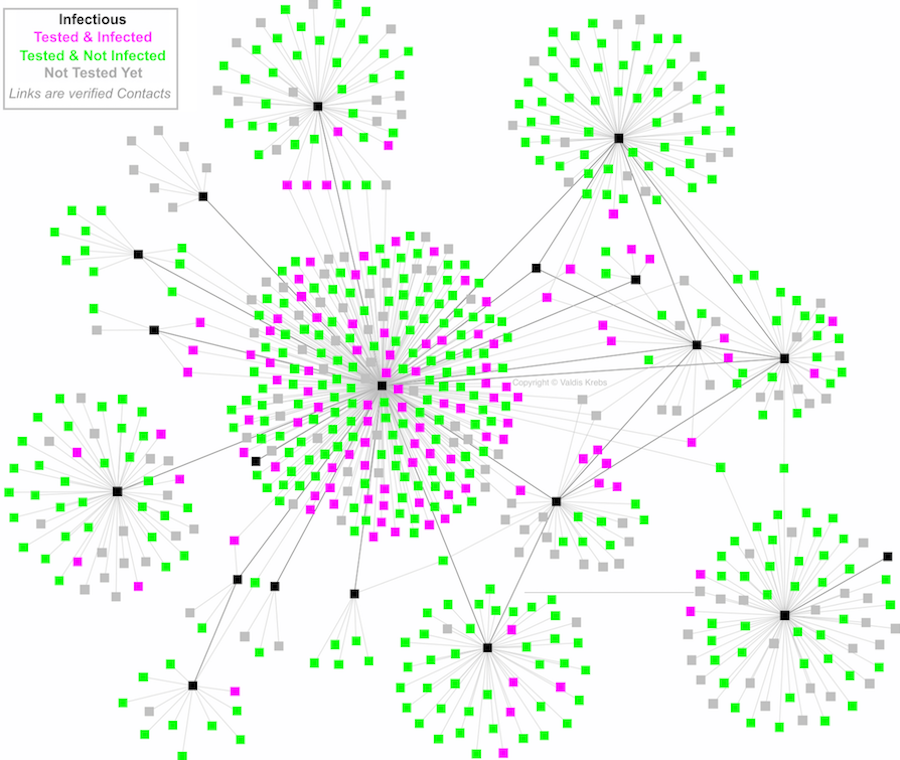 Figure 1
 Figure 2
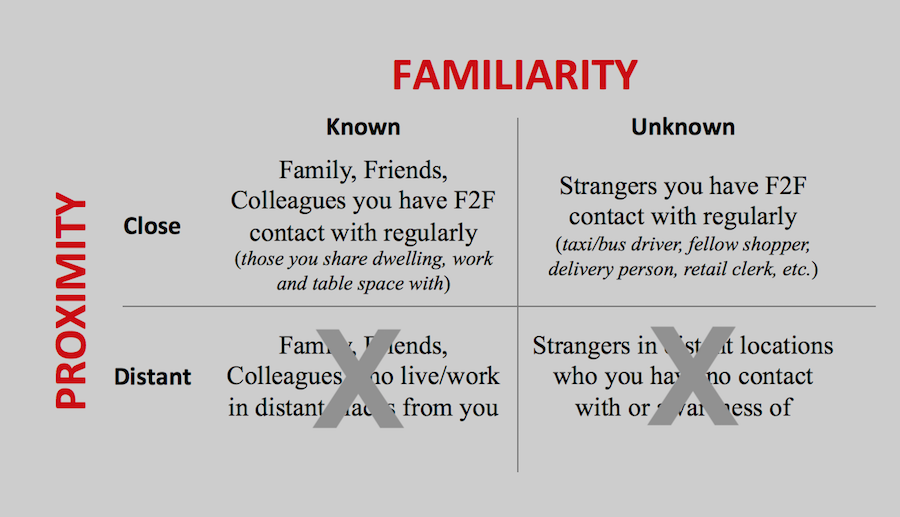 Figure 3
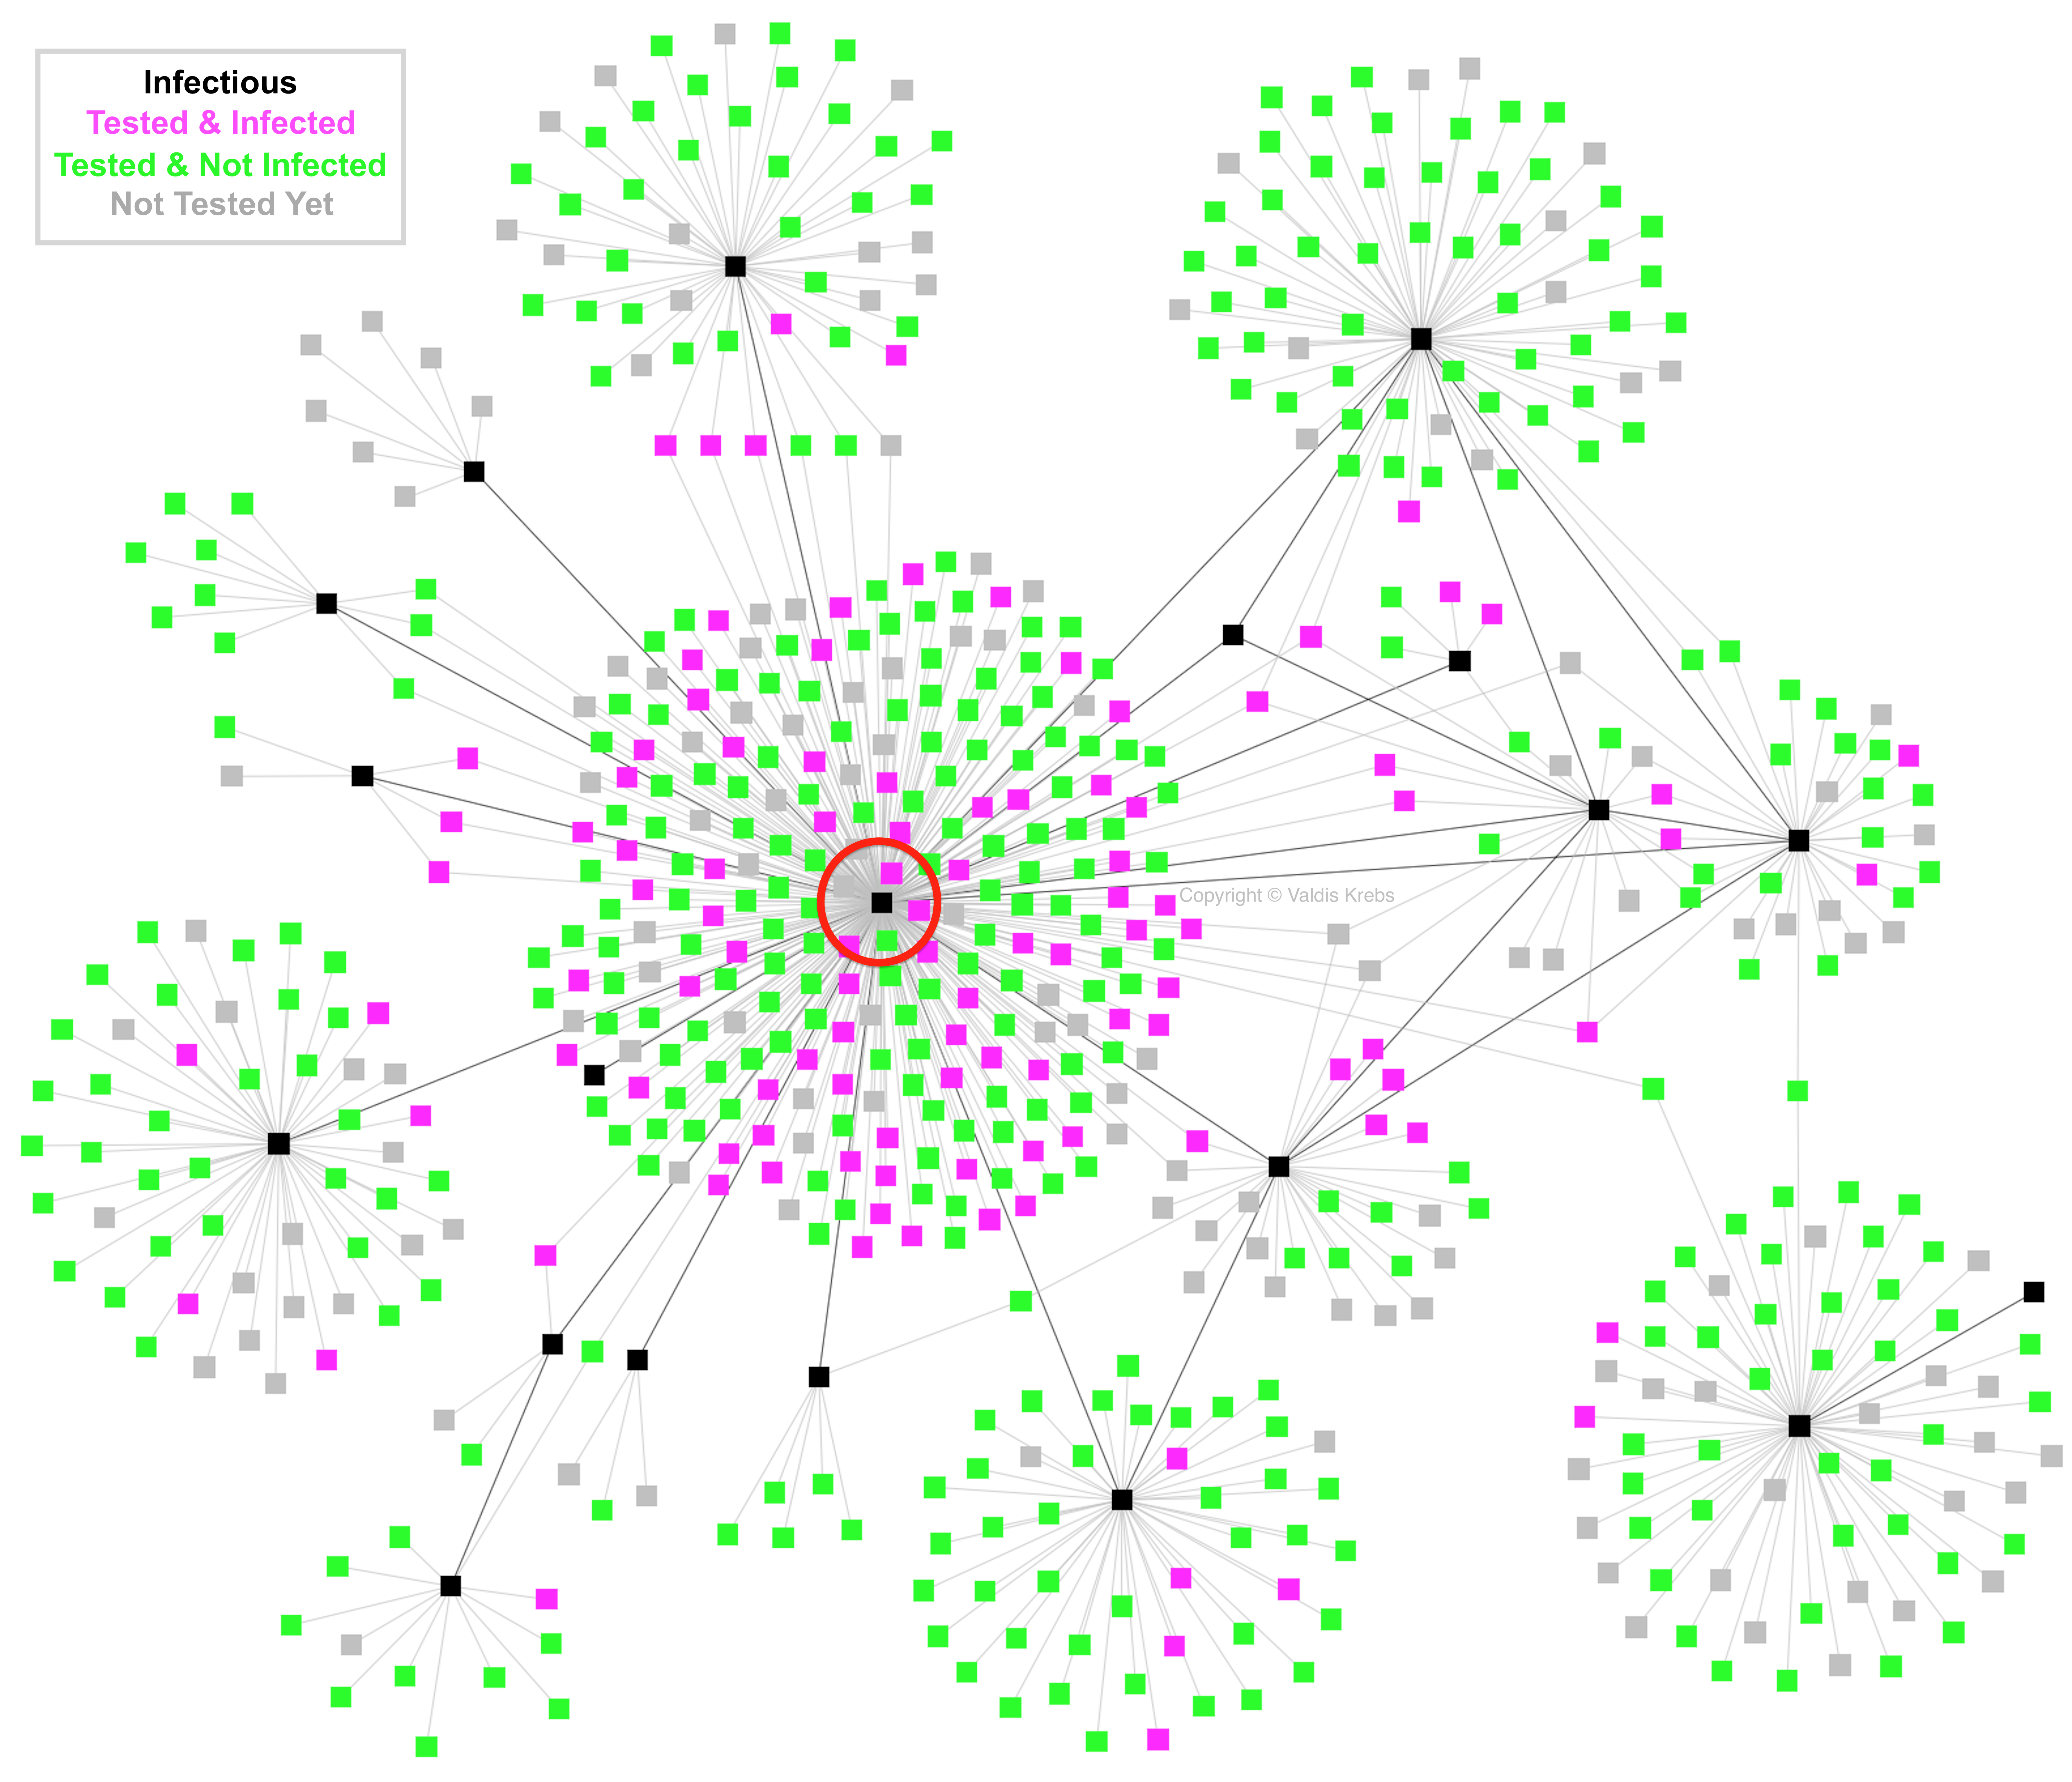 Figure 4
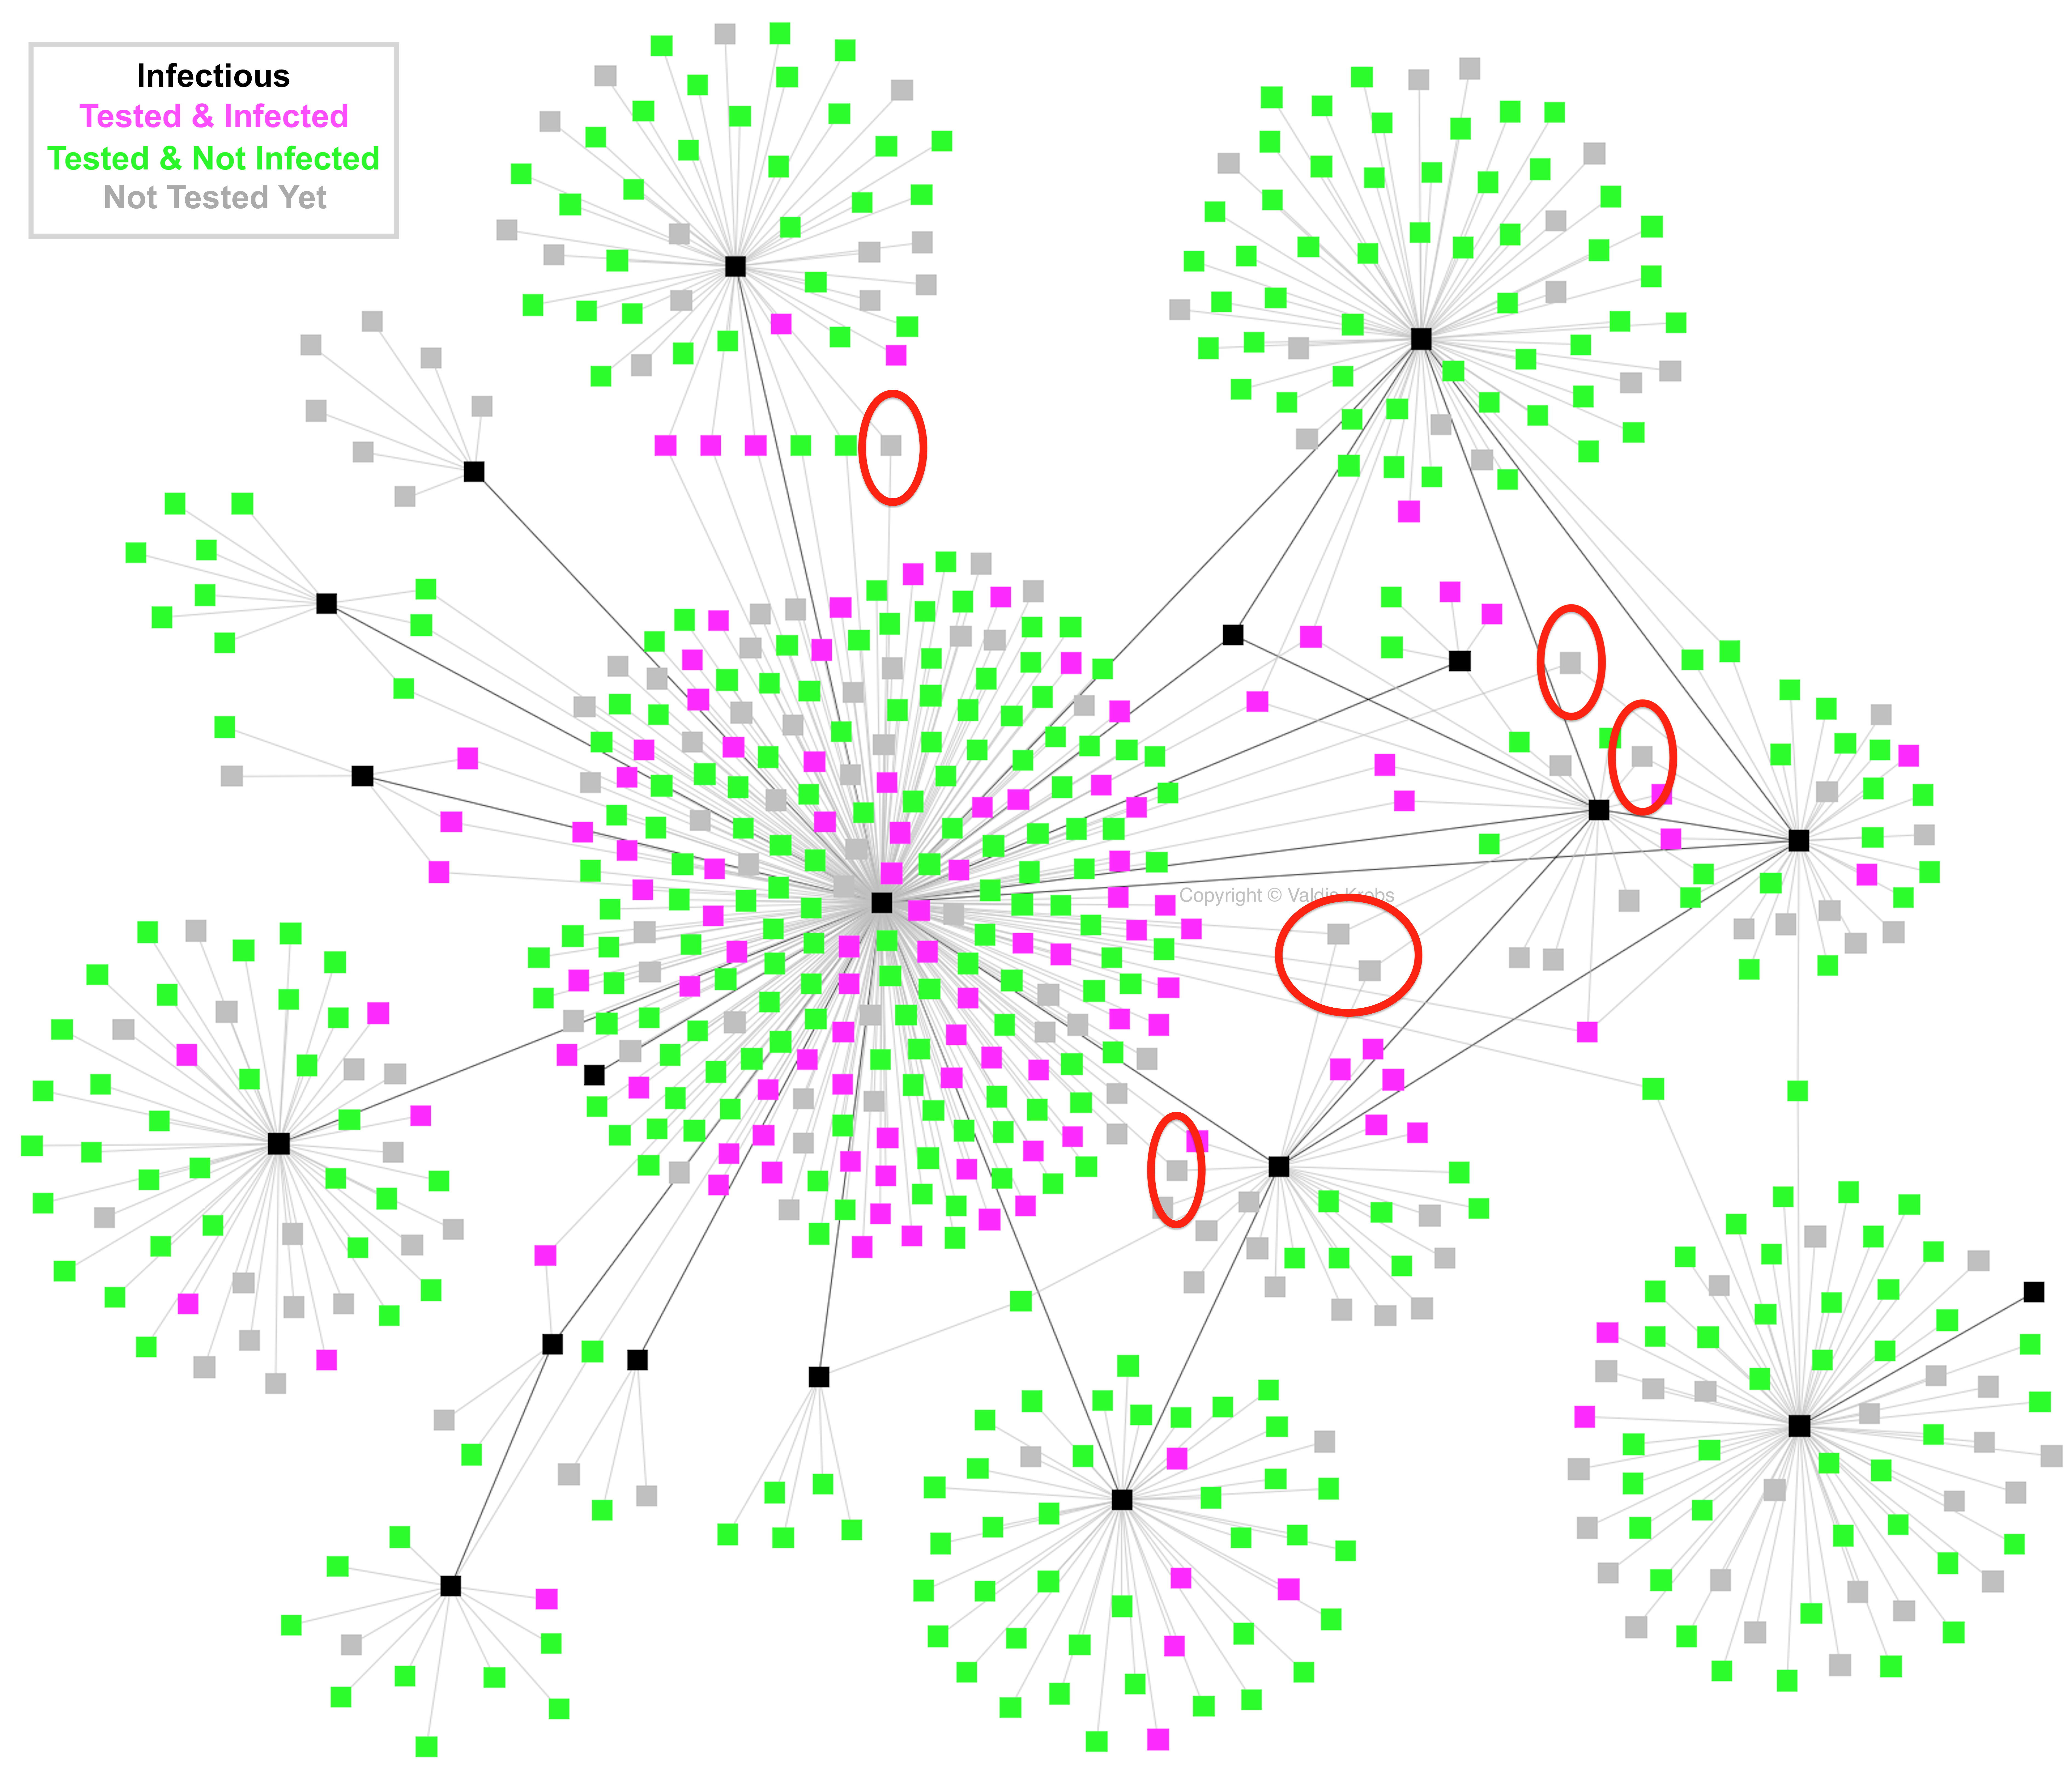 Figure 5
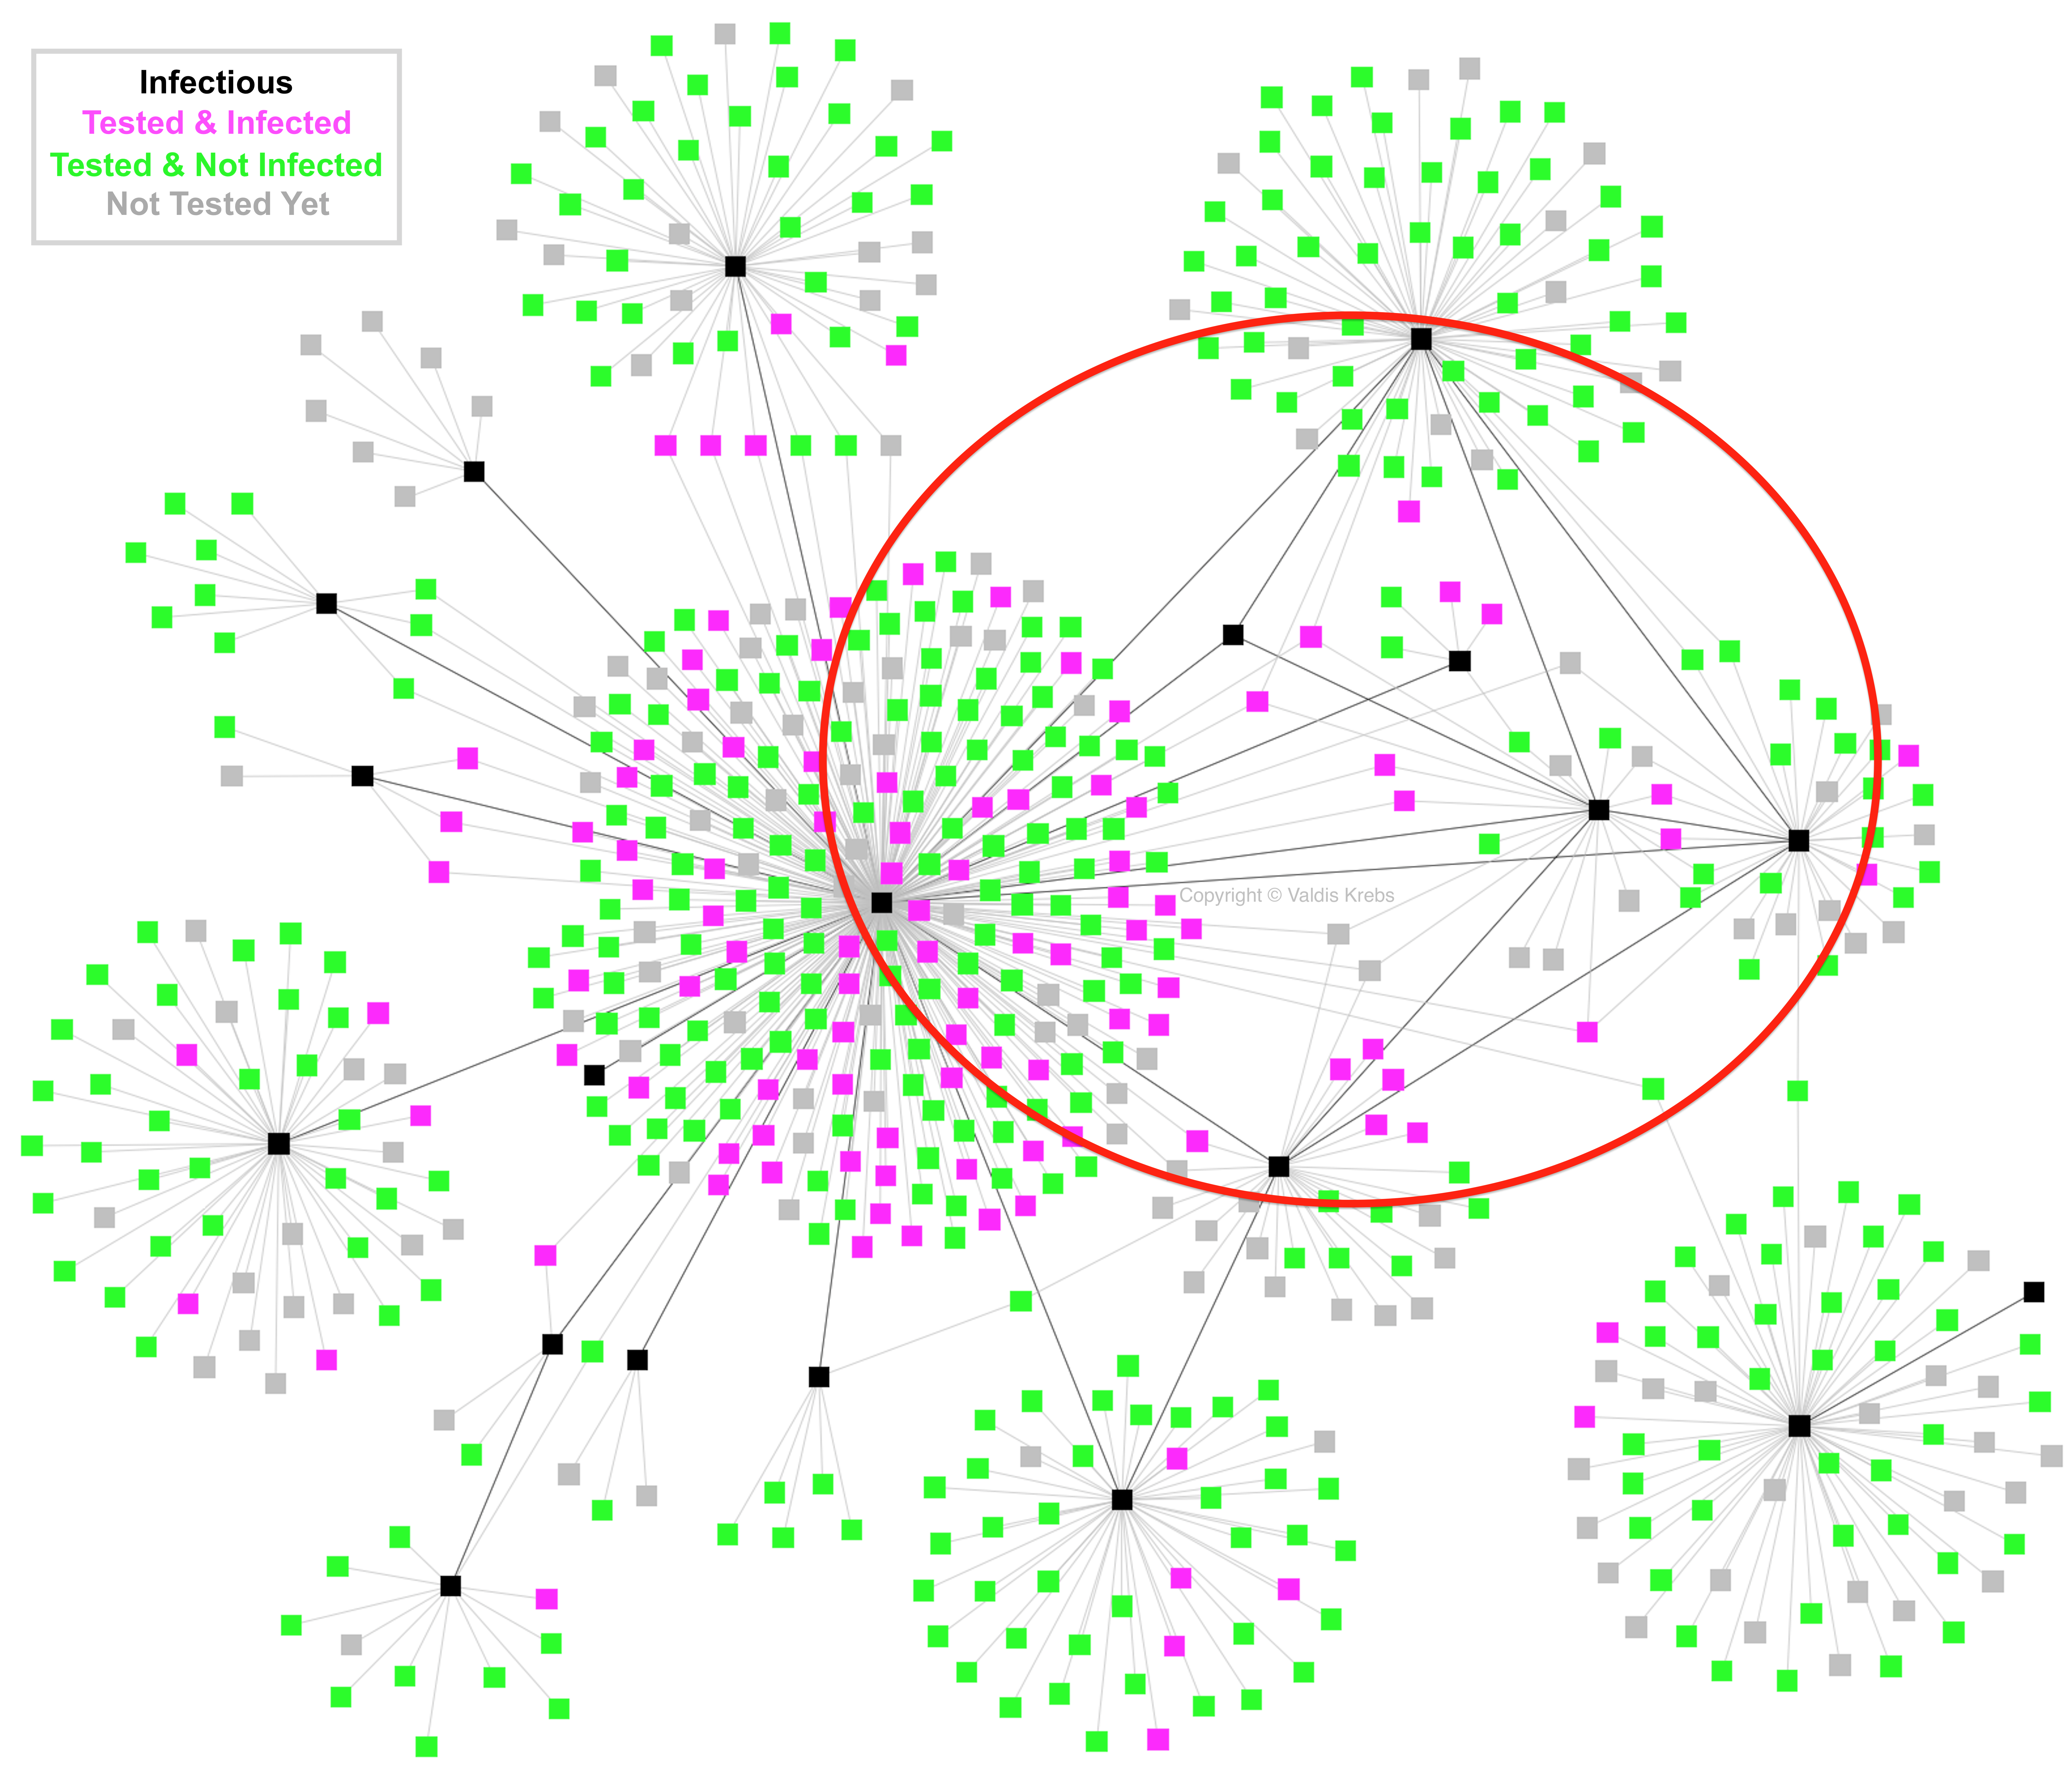 Figure 6